
Trading near-term breakout stocks can be one of the most rewarding strategies for active traders. However, it requires sharp technical analysis skills, awareness of market-moving catalysts, and a strong grasp of risk management principles. A breakout occurs when a stock moves outside a defined price range—typically through a resistance level in an uptrend or support level in a downtrend—often accompanied by a surge in volume.
In this comprehensive guide, we will explore the critical components of successfully trading near-term breakout stocks. We will cover chart setups, the importance of volume and price movement, how technical indicators such as VWAP (Volume Weighted Average Price) and RSI (Relative Strength Index) come into play, and how catalysts like news events or earnings can fuel these moves.
Understanding Breakouts: The Basics
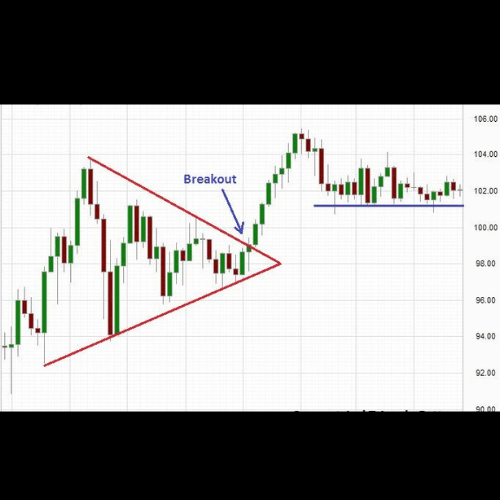
A breakout is an opportunity to capture rapid price movements when a stock pushes beyond a key technical level—most commonly resistance in an uptrend. Breakouts signal that a new phase of price discovery may be underway, often leading to continued momentum in the breakout direction.
For a breakout to be valid, several key elements need to be in place:
Well-defined price level: Resistance and support should be clear, with the stock testing these levels multiple times before the breakout.
Volume surge: A breakout with low volume is often a false signal. Significant volume should accompany a true breakout.
Momentum: Breakouts are driven by momentum; once resistance is cleared, traders rush to buy, pushing prices higher.
The Initial Chart Setup
Before the breakout, it is essential to have a proper chart setup to recognize opportunities and evaluate the risk-reward potential. Here are some key steps to setting up your chart for identifying breakout stocks:
Identify Key Support and Resistance Levels: Start by analyzing the price history to identify critical levels of resistance (the ceiling a stock struggles to break above) and support (the floor that prevents the stock from falling further). Look for previous tests of these levels, as the more times a level is tested, the stronger it becomes. A breakout through a strong resistance level suggests a powerful move ahead.
Use Multiple Timeframes: Analyzing different timeframes helps you gain a broader perspective. For instance, while you may be trading on a 5-minute chart for short-term moves, looking at the 1-hour or daily chart will help you identify longer-term trends and significant support and resistance levels.
Pattern Recognition:
Breakouts often form after recognizable chart patterns such as:
Ascending Triangle: Higher lows are formed as buyers step in aggressively, pushing the stock toward resistance, creating a pressure build-up. The breakout occurs when resistance is finally broken.
Cup and Handle: This pattern involves a rounded bottom (the cup) followed by a slight pullback (the handle) before breaking out.
Flags and Pennants: These short-term continuation patterns can indicate brief consolidations before the stock continues its upward or downward momentum.
Track the Moving Averages: Moving averages (such as the 50-day and 200-day MA) can act as dynamic support and resistance levels. A stock breaking out above its 50-day moving average, for example, is often viewed positively by traders, signaling a potential trend reversal or continuation.
The Role of Volume in Breakouts
Volume is arguably the most critical confirmation of a breakout. For a breakout to be sustainable, it needs to be accompanied by a significant increase in trading volume. Here’s why volume matters:
Volume Confirms Price Movement: A breakout on low volume can indicate a false move or lack of conviction from traders. In contrast, a breakout on high volume suggests that many market participants are involved, and the price move is likely to sustain.
Volume Precedes Price: A spike in volume often occurs before a breakout, as traders accumulate positions in anticipation. This early volume spike can serve as a warning sign that a breakout is imminent.
Track Volume on Retests: If the stock breaks out and then retests the former resistance level (which has now become support), strong volume on the retest often confirms that the breakout is legitimate and offers a good entry point for traders who missed the initial move.
VWAP: Importance of Holding Above
The Volume Weighted Average Price (VWAP) is a crucial tool for breakout traders. VWAP represents the average price a stock has traded at throughout the day, based on both volume and price. It is widely used by institutional traders and provides a valuable benchmark for determining the strength of a breakout.
Support and Resistance Role: When a stock is trading above the VWAP, it’s generally considered bullish, as it shows the stock is gaining momentum. If a breakout occurs and the stock holds above the VWAP, it often indicates strong buying interest and suggests the move is likely to continue. Conversely, if a stock falls below the VWAP after a breakout, it may be a sign of weakening momentum, and traders should be cautious of a possible reversal.
VWAP Reclaim: If a stock pulls back after the breakout but manages to hold or reclaim the VWAP, this can be a great re-entry point, as it suggests buyers are stepping in again.
Intraday Breakouts: On an intraday level, many day traders use VWAP as a critical line in the sand. A breakout that happens with strong volume above the VWAP is a positive sign of sustained momentum, while a breakout below the VWAP can indicate a potential false move.
RSI: Timing the Entry and Exit
The Relative Strength Index (RSI) is a momentum oscillator that measures the speed and change of price movements. It is particularly useful in breakout trading as it helps assess whether a stock is overbought or oversold.
RSI Ranges for Breakouts: An RSI reading above 70 suggests that a stock is overbought, while a reading below 30 indicates that a stock is oversold. For breakout trades, RSI readings between 50 and 70 are often considered ideal, as this range indicates that the stock has strength but is not yet overextended. Breakouts with an RSI around 60-65 tend to be healthier, with more room for continued upside.
Divergence as a Warning Sign: Pay attention to RSI divergence. If a stock is breaking out, but the RSI is diverging (moving lower while price moves higher), this can signal weakening momentum, and the breakout may fail.
Use RSI to Manage Exits: As the breakout progresses, watch for the RSI to move into the 70+ range. This can be an indication that the stock is becoming overbought, and traders might consider taking partial profits or tightening stop-losses.
The Impact of Catalysts: News and Earnings
Breakouts are often fueled by catalysts—whether it’s positive earnings, a major contract announcement, an acquisition, or a broader market event. These catalysts create the momentum necessary to push the stock through resistance levels and drive increased volume. Here’s how to incorporate catalysts into your breakout strategy:
Earnings Reports: Stocks often break out after better-than-expected earnings. In these cases, the breakout is supported by a fundamental catalyst, which increases the likelihood of sustained momentum. Look for stocks that gap up on earnings and hold their gains during the day as a sign of strength.
News Announcements: Major corporate news, such as product launches, partnerships, or regulatory approvals, can serve as powerful catalysts for breakouts. Stocks that break out on significant news and follow through with increased volume are more likely to hold their gains.
Sector or Market Sentiment: Occasionally, stocks in a particular sector may experience a breakout due to broader market sentiment. For example, biotech stocks could rally on favorable FDA news for one company, leading others in the sector to break out.
High-Volume Days: Even without specific news, a surge in trading volume can suggest a breakout is imminent. Traders should monitor stocks with unusual volume, as this often precedes a breakout move.
Managing Risk in Breakout Trading
While breakout trading can be highly lucrative, it is also inherently risky. The key to long-term success lies in managing your risk and controlling your downside. Here are several strategies to mitigate risk:
Set Clear Stop-Loss Levels: Use technical levels to determine your stop-loss, such as placing it just below the breakout level or the nearest support level. This ensures you exit the trade if the breakout fails and the stock reverses direction.
Position Sizing: Avoid putting too much of your capital into a single breakout trade. Instead, use position sizing to limit risk. Many traders risk no more than 1-2% of their account value on any given trade.
Look for Confirmations: Avoid chasing the breakout immediately after it happens. Wait for the stock to confirm the move by holding above the breakout level or retesting it as support. Patience can prevent you from getting caught in a false breakout.
Partial Profits: As the stock moves in your favor, consider taking partial profits along the way. This locks in gains while allowing you to stay in the trade to capture further upside.
Conclusion
Trading near-term breakout stocks can be an exciting and profitable strategy when executed correctly. By focusing on the right chart setup, using technical indicators like VWAP and RSI, monitoring volume spikes, and understanding the impact of news and catalysts, traders can better identify breakouts with high potential. However, success in breakout trading also hinges on managing risk effectively, staying disciplined, and avoiding emotional decision-making.
To succeed in this strategy, traders need to develop a keen sense of chart patterns, wait for confirmation from volume and price action, and continuously adapt their approach to changing market conditions. With the right combination of technical analysis, news awareness, and risk management, trading near-term breakout stocks can lead to significant profits.
Watch your email and text messages for our next breakout stock alert.
by Steve Macalbry
Senior Editor,
BestGrowthStocks.Com
Disclaimer: The author of this article is not a licensed financial advisor. This article is intended for informational purposes only. It should not be considered financial or investment advice. We have not been compensated for the creation or distribution of this article and we do not hold any form of equity in the securities mentioned in this article. Always consult with a certified financial professional before making any financial decisions. Growth stocks carry a high degree of risk, and you could lose your entire investment.