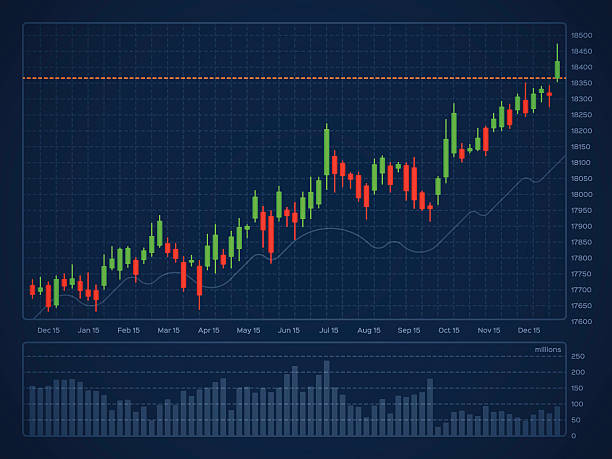
The stock market is an intricate maze that draws millions of people from around the world, attempting to unravel its enigmatic patterns. One popular method to comprehend these patterns is technical analysis. By interpreting statistical trends gathered from trading activity, such as price movement and volume, investors aim to predict future price trends. This article focuses on three widely used technical analysis tools – the Relative Strength Index (RSI), Bollinger Bands, and Moving Averages (20, 50, and 200 days).
Relative Strength Index (RSI)
Introduced by J. Welles Wilder Jr. in 1978, the RSI is a momentum oscillator that measures the speed and change of price movements. It oscillates between zero and 100 and is typically used to identify overbought or oversold conditions in a market.
When the RSI for a particular stock exceeds 70, it’s often considered overbought, which suggests that it may be overvalued and a price correction could be around the corner. Conversely, when the RSI falls below 30, the stock is considered oversold, indicating it may be undervalued, and thus a buying opportunity may arise.
RSI can also be used to identify divergences, which occur when the price of an asset is moving in the opposite direction of the RSI. This divergence can often be a sign of an impending reversal in price trend.
Bollinger Bands
John Bollinger introduced Bollinger Bands in the 1980s as a volatility indicator. It consists of a simple moving average (SMA) line, with two standard deviation lines plotted above and below it.
The basic interpretation of Bollinger Bands is that price tends to stay within the upper and lower bands. When the price continuously touches the upper band, the market is considered overbought, indicating the possibility of a sell signal. Conversely, when the price touches the lower band, it indicates an oversold market, potentially giving a buy signal.
Moreover, the width of the bands also holds significance. A sudden increase in the band’s width often signifies the end of a trend, while a narrow band can indicate the start of a new trend.
Moving Averages: 20, 50, and 200 Day
Moving averages, one of the most basic yet effective technical analysis tools, are used to identify trend directions and reversal points. They smooth out price data by creating a constantly updated average price.
In the context of this article, we’ll focus on three commonly used types: the 20-day, 50-day, and 200-day moving averages.
The 20-day moving average is often used to identify short-term trends. It reacts more quickly to recent price changes than longer-term moving averages.
The 50-day moving average is used by traders to gauge the mid-term trend. When a stock is trading above its 50-day moving average, the trend is considered positive or bullish.
The 200-day moving average is used to measure the long-term trend. A stock trading above its 200-day moving average is considered in a long-term uptrend, while one below this level is considered in a long-term downtrend.
Moving averages can also provide support or resistance to the price of an asset. If a stock price falls towards its moving averages, these averages can often serve as a price floor.
A popular strategy that utilizes moving averages is the “Golden Cross” and the “Death Cross”. The Golden Cross occurs when a short-term moving average (like the 50-day) crosses above a long-term moving average (like the 200-day), signaling a potential bullish price rally. Conversely, the Death Cross occurs when the short-term moving average crosses below the long-term moving average, signifying potential bearish activity.
Conclusion
In the world of technical analysis, RSI, Bollinger Bands, and Moving Averages serve as powerful tools for traders and investors. However, like all tools, their effectiveness depends on their application. It’s crucial to understand that while these indicators can provide valuable insight, they should not be used in isolation. Other market factors, including fundamental analysis and broader economic indicators, should also be taken into account when making investment decisions. Always remember, the stock market is not a science but an art – an art of comprehending trends, understanding signals, and making informed decisions.
Visit Best Growth Stocks Complimentary Charting Tools Page
Disclaimer: This article is intended for informational purposes only. It should not be considered financial or investment advice. Always consult with a certified financial professional before making any significant financial decisions.


