

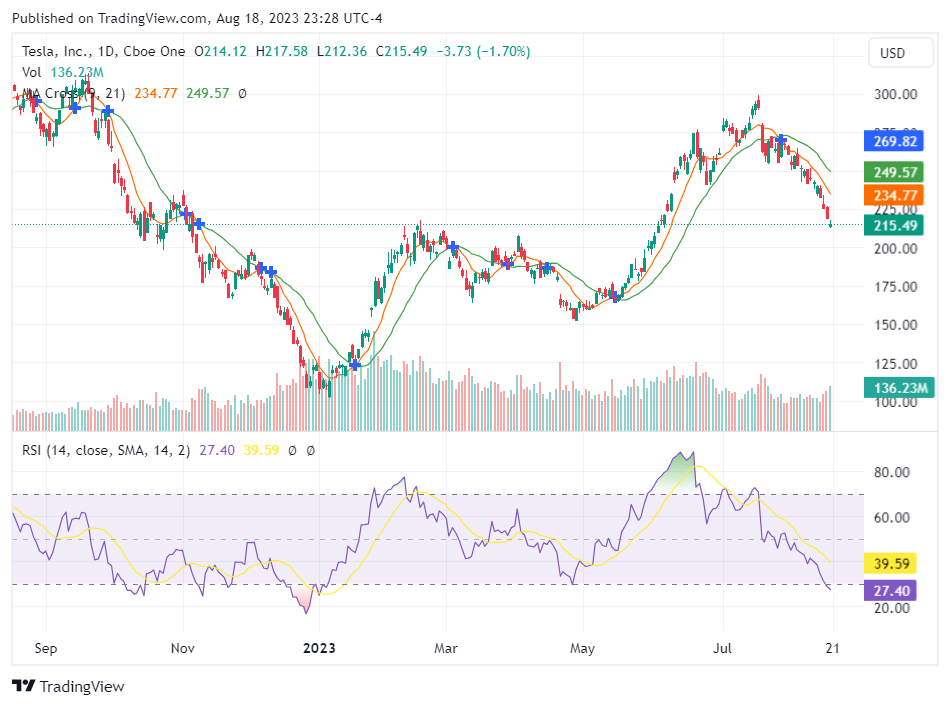
Is Tesla (TSLA) currently a market anomaly? Fluctuating around an RSI of 27, Tesla Inc (NASDAQ: TSLA) seems to have entered the oversold zone, despite showing robust gains earlier in the year. The current Earnings Per Share (EPS) of 3.53 hints at potential undervaluation. To decipher this intricate conundrum, we offer a thorough valuation analysis of Tesla to guide investment strategies.
Tesla’s Pioneering Journey in a Nutshell
Hailing from the tech nucleus of Palo Alto, California, and established in 2003, Tesla epitomizes the global shift towards sustainable energy. With offerings that encompass solar panels, solar roofs, and stationary storage batteries, Tesla’s commitment to clean energy is evident. Their vehicle portfolio, ranging from luxury sedans to a semi-truck, has showcased impressive diversification. With a delivery accomplishment of 1.3 million vehicles globally in 2022, the stock’s present price of $214.66 per share perplexes, especially given certain analysts’ loftier expectations of upwards of $450.00/share.
Decoding Tesla’s Intrinsic Worth
Stock valuation isn’t merely an arithmetic endeavor; it’s a fine blend of historical performance metrics, adjustments rooted in past growth, and future business trajectory projections. When the stock price drifts considerably above the analyst-projected value, it hints at overvaluation, and vice versa. Currently, the intricate matrices, which weave in historical figures and analyst growth anticipations, suggest Tesla (NASDAQ: TSLA) is severely undervalued. This augurs well for the stock’s potential near and long-term appreciation.
Tesla’s Financial Pillars: Robustness and Sustainability
The danger of neglecting a company’s financial muscle is the potential erosion of capital. Tesla’s financial moorings seem robust with a cash-to-debt ratio of 3.97, situating it favorably among 80.87% of its industry peers. Such indicators lend credence to its financial health, which some analysts resonate with by assigning a commendable rank of 9 out of 10.
Profitability, Growth, and the Bigger Picture
Historical profitability is often a harbinger of reduced risk. Out of the last decade, Tesla has enjoyed profitability for 3 years. With an annual revenue clocking $94 billion and an EPS of $3.53 in the recent year, coupled with an operating margin of 13.49% that outpaces 88.2% of its industry competitors, Tesla’s fiscal health seems stable.
But valuation doesn’t thrive on past glories alone. The propellant is growth. And Tesla’s impressive average annual revenue growth of 36.4% and a 3-year average EBITDA growth of 83.9% underline its potential.
Another cogent metric in the profitability puzzle is juxtaposing a company’s Return on Invested Capital (ROIC) with its Weighted Average Cost of Capital (WACC). With Tesla’s ROIC hovering at 24.6 and the WACC at 19.48 in the past year, the company indeed appears to be generating shareholder value.
The Stock’s Search for Support and the Big Question
Amid this backdrop, the stock appears to be scouting for support. A key indicator to watch is the 200-day moving average, which currently hovers between $196-$200/share. This could potentially serve as a foundational base for the stock’s future movements.
In Closing:
To encapsulate, Tesla’s current market position seems to diverge from its intrinsic value. Its financial pillars stand tall, profitability appears poised, and growth trajectories are impressive. For astute investors, this disparity might spell opportunity in the dynamic ecosystem of the Electric Vehicles & Parts industry.
Disclaimer: The author is not a licensed financial advisor and the content provided is for informational purposes only. Furthermore, the author of this article does not own any shares of TSLA as of 08/18/2023. Always consult with a certified financial advisor before making investment decisions.